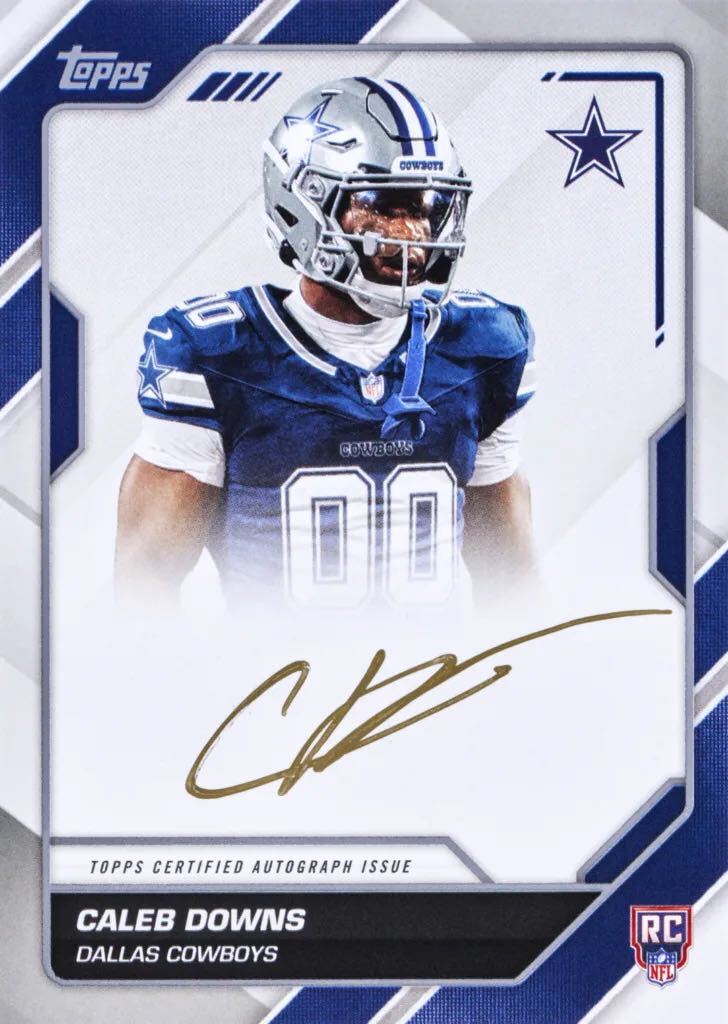
Caleb Downs Is the Only 2026 Topps Flagship Football Rookie Where Price and Volume Are Both Rising
Every other name in the class is selling at record velocity while losing 23 to 41 percent of its value. That split is the story: and it tells you exactly what to do before September 9.
One number does not belong. Caleb Downs' base card from 2026 Topps Flagship Football is up 82.5% in average price over the last seven days, on 101 sales at 47 times his prior baseline. Every other rookie in the set is doing the opposite. Ty Simpson's Silver Pack Mojo Refractor moved 107 copies at 175 times its baseline and lost 32.2% of its average price in the process. Fernando Mendoza's base card sold 746 times, 45x its prior rate, and shed 23.6%. De'Zhaun Stribling's Silver Pack Mojo Refractor: 90 sales, 98x velocity, down 37.2%. Drew Allar's Silver Pack Mojo Refractor and base card combined for over 200 transactions and lost 36 to 38 percent of their value doing it.
The volume numbers look, at first glance, like a hot market. They are not. They are the mechanism of the decay.
What Box-Break Economics Actually Do to a 592-Million-Card Set
When 2026 Topps Flagship Football hit shelves on August 21, the secondary market clock started. Box breakers pulled cases, sorted rookies, and listed them immediately: which is exactly what the model incentivizes. The result is a supply wave that arrives faster than organic collector demand can absorb it, and the transaction data captures that wave in real time. High velocity in this context does not mean buyers are competing for scarce cards. It means sellers are competing against each other for the same pool of buyers, and the only lever available is price.
Sports Card Investor flagged the Flagship Football print run at an estimated 592 million cards: a number that reframes every velocity figure in this data set. At that scale, there is no supply constraint creating urgency. Every box break that adds cards to the market is a new seller undercutting the last one, and the transaction count climbs precisely because the clearing price keeps dropping. Mendoza at 746 sales and minus 23.6% is not evidence of demand; it is evidence of a market finding its floor by moving volume through price compression. Simpson at 175 times baseline with a 32% price loss is the same story told faster.
This is a distribution event. Collectors who bought Flagship Football rookies in the first days after launch and are watching their sales velocity charts light up should understand what that velocity is actually telling them: the market is not heating up around their card. The market is repricing it downward, one transaction at a time, and each sale is a seller accepting less than the one before.
The Downs Divergence
Against that backdrop, Caleb Downs' base card reads as a genuine anomaly. One hundred and one sales at 47 times his prior baseline would be unremarkable if the price were falling. That would just be the same distribution story with a different name on the card. What separates Downs is that his average transaction price is higher at the end of the seven-day window than it was at the start. Price and volume rising together is the signature of real demand meeting constrained supply, or of a market pricing in new information.
The question the data cannot answer is which of those two things is happening. Downs' depth-chart role and projected Week 1 usage heading into September 9 are unconfirmed at this writing, and without a specific on-field catalyst, the 82.5% price gain is a signal without a verified source. It is possible the market knows something about his role that has not yet surfaced publicly. It is equally possible that a thinner trading history made his baseline easier to move, and that the divergence is partly a statistical artifact of a smaller prior sample. Both readings are live until his usage becomes clear.
What is not ambiguous is the structural fact: Downs is the only rookie in this class where the velocity-price relationship looks like buying rather than selling. That is worth watching regardless of the cause.
High velocity in this context does not mean buyers are competing for scarce cards. It means sellers are competing against each other for the same pool of buyers, and the only lever available is price.
Hold, Sell, or Watch: A Position on Each Name Before September 9
For Mendoza, Simpson, Stribling, and Allar, the velocity data is not a reason to buy. It is the reason prices are falling. If you are holding any of these cards and waiting for the NFL opener to provide a catalyst, the base case is that September 9 will not outrun the supply glut. It will only determine whether the floor holds or gives way further based on who plays and who produces. The window to sell into remaining volume is open now, while box-break buyers are still active in the market. It narrows the moment Week 1 results arrive and reprice expectations in one direction or the other.
Allar's refractor and base card both showing 36 to 38 percent declines on substantial volume suggests the market has already made a judgment about his near-term upside relative to supply. Stribling's 37.2% drop on 98x velocity tells the same story. These are not cards in the process of finding buyers. They are cards in the process of finding sellers willing to accept the clearing price.
The Mendoza Silver Pack Mojo Refractor, moving at 51x velocity with a 35% price decline and a roughly $51 average transaction, is an interesting case. Lower print runs typically establish floors faster because supply is genuinely constrained. Whether that floor is forming here or whether the refractor is simply following the base card's decay curve at a higher price point is a question the next week of transaction data will answer. The base card's 23.6% decline is shallower than the refractor's 35%, which runs counter to what you would expect if the refractor were finding support from scarcity. That gap is worth monitoring.
For Downs: the divergence is real. Do not dismiss it. But do not size up on the price move alone without clarity on the depth-chart situation that may or may not be driving it. If his Week 1 role confirms what the card market appears to be pricing in, the 82.5% gain could look like the beginning of a move. If it does not, the card is exposed to the same supply pressure that has already hit everything else in the set.
What September 9 Actually Decides
The NFL opener does not rescue cards that are already in freefall from a supply glut. What it does is replace projection with evidence. Every Flagship Football rookie currently priced on camp performance and preseason speculation gets repriced on actual snaps, targets, carries, and production: and that repricing happens fast. For the cards already down 30 to 40 percent, a strong Week 1 from the player behind them could stabilize a floor. A quiet game, an injury, or a depth chart that does not match the market's assumptions will push those floors lower.
The 592-million-card print run means there is no shortage of supply waiting to hit the market as the season progresses. Box breaks will continue. New sellers will continue to undercut the last clearing price. The velocity-price split visible right now in this week's data is not a temporary condition created by launch week chaos. It is the structural reality of a mass-market football set in the modern hobby. Volume will stay high. The question is whether any individual rookie can generate enough genuine demand to outrun it.
Right now, the data says one of them might be trying.
Follow the hobby in the app
Track the products and players you collect and get told the moment anything moves.
Open Collector Nation